Platform

See at a glance what Scalera does for your back office.

Analytics shows you the AI's matching performance, how your projects move from request to win, and how your product catalogue is used. Figures instead of estimates, for any time period, with export.

Logo ERNE

Trusted by 150+ leading industry companies

Ergebnisse aus der Praxis

Frauenthal Handel Gruppe: über 80 % Präzision insgesamt und über 90 % bei strukturierten Leistungsverzeichnissen.

Titelbild der veröffentlichten Scalera-Fallstudie mit Frauenthal Handel Gruppe

«Wir erreichen über 80% Präzision insgesamt – und übertreffen bereits 90% bei Leistungsverzeichnissen.»

Florian Bouchal

CSO & Vorstandsmitglied, Frauenthal Handel Gruppe

Case Study lesen

Drei Blickwinkel auf deinen Angebotsprozess
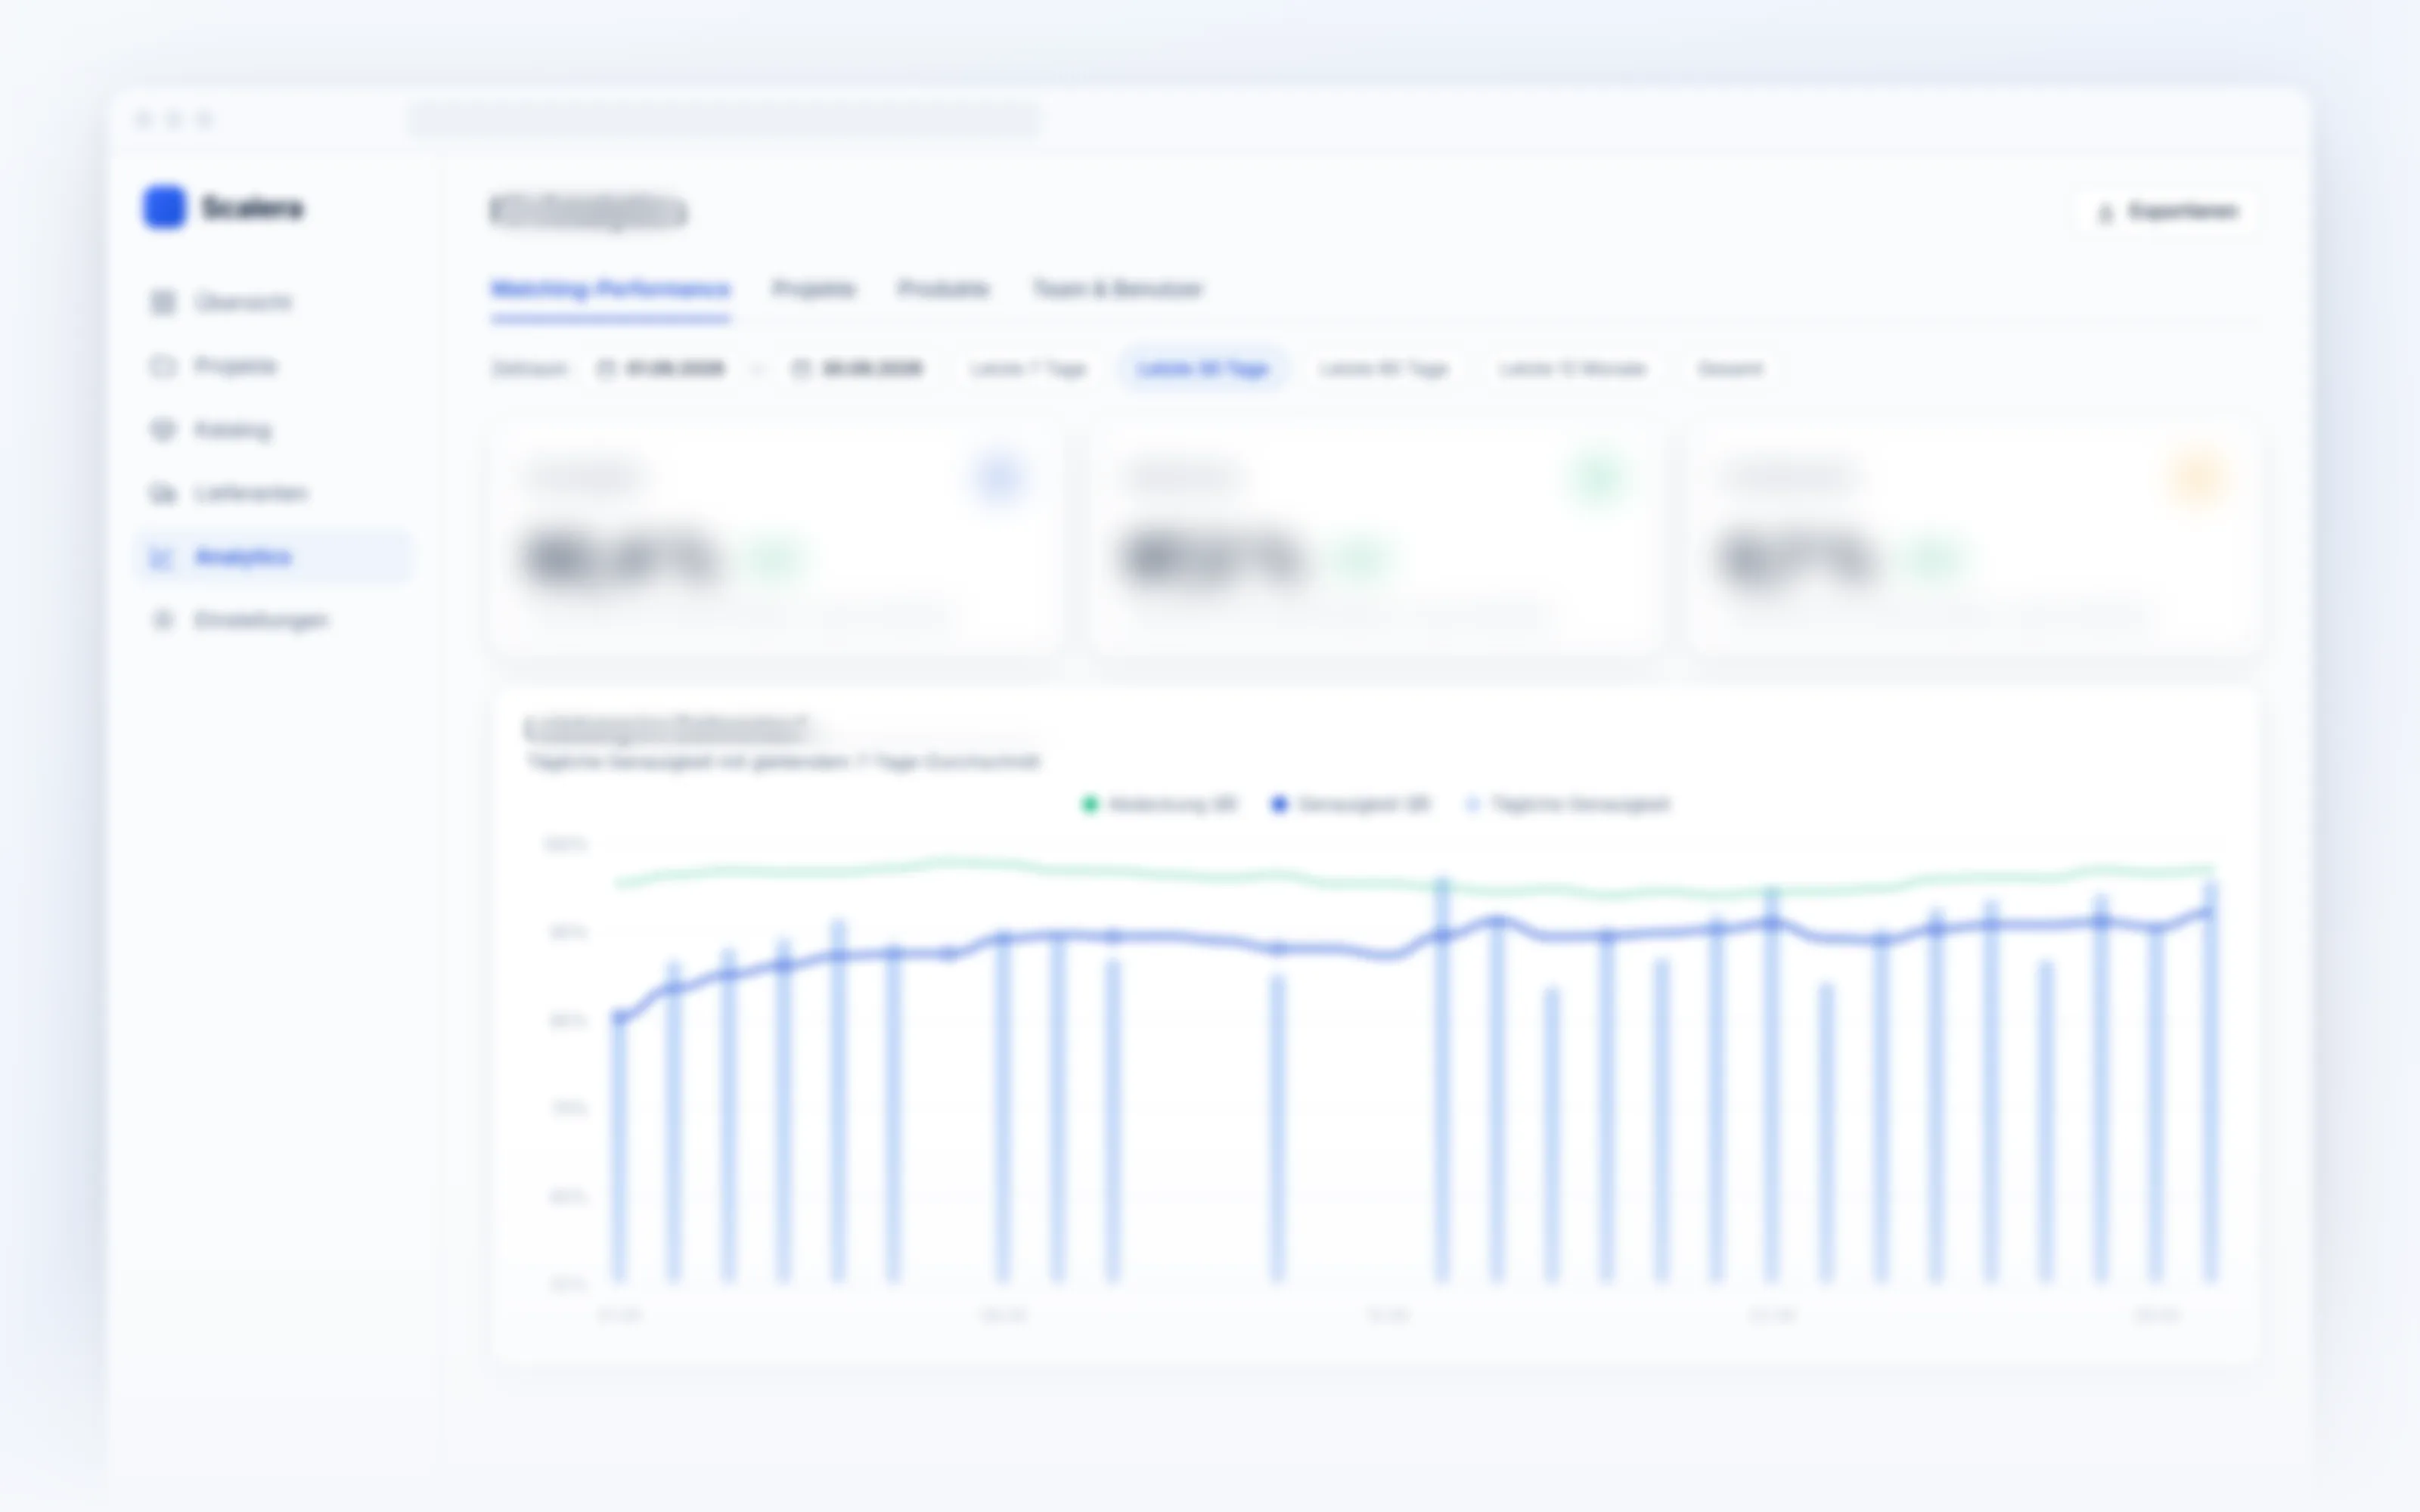
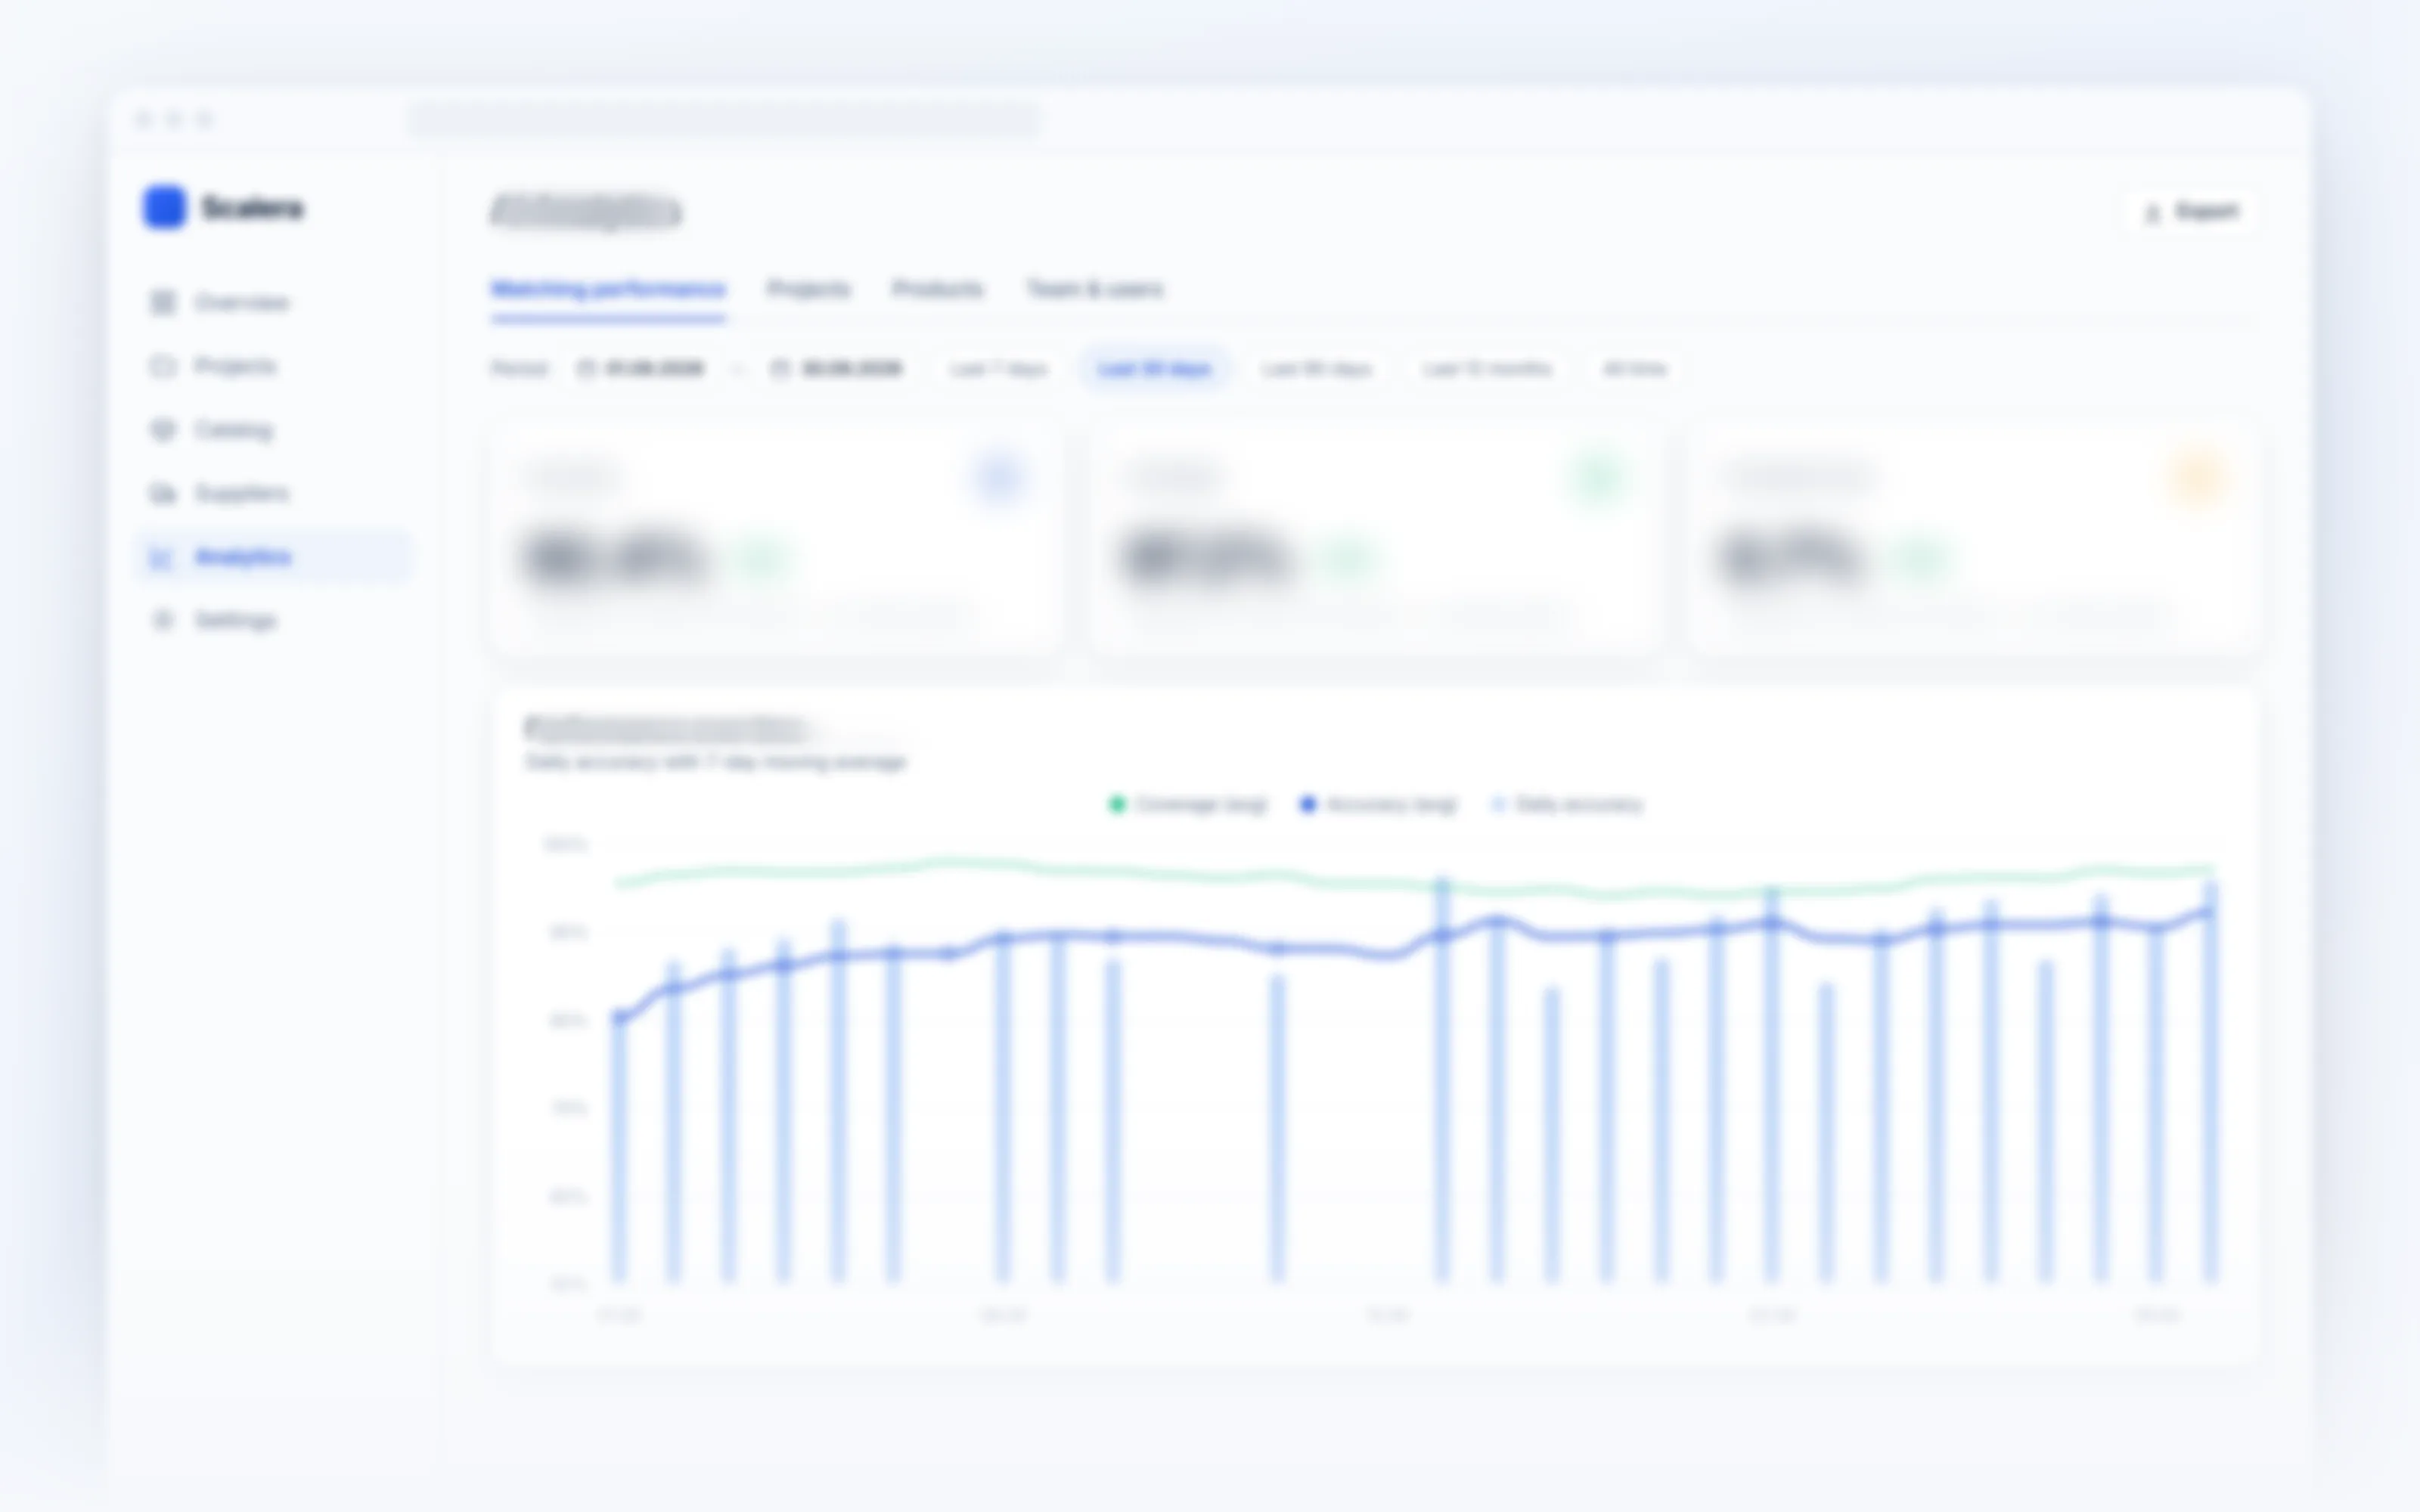
Scalera KI-Analytics, Ansicht Matching-Performance: drei Kennzahlen zu Genauigkeit, Abdeckung und Korrekturrate und ein Diagramm, das die Leistung im Zeitverlauf zeigt

Matching-Performance.

Genauigkeit, Abdeckung relevanter Positionen, Korrekturrate, Bearbeitungszeit und die Entwicklung im Zeitverlauf.
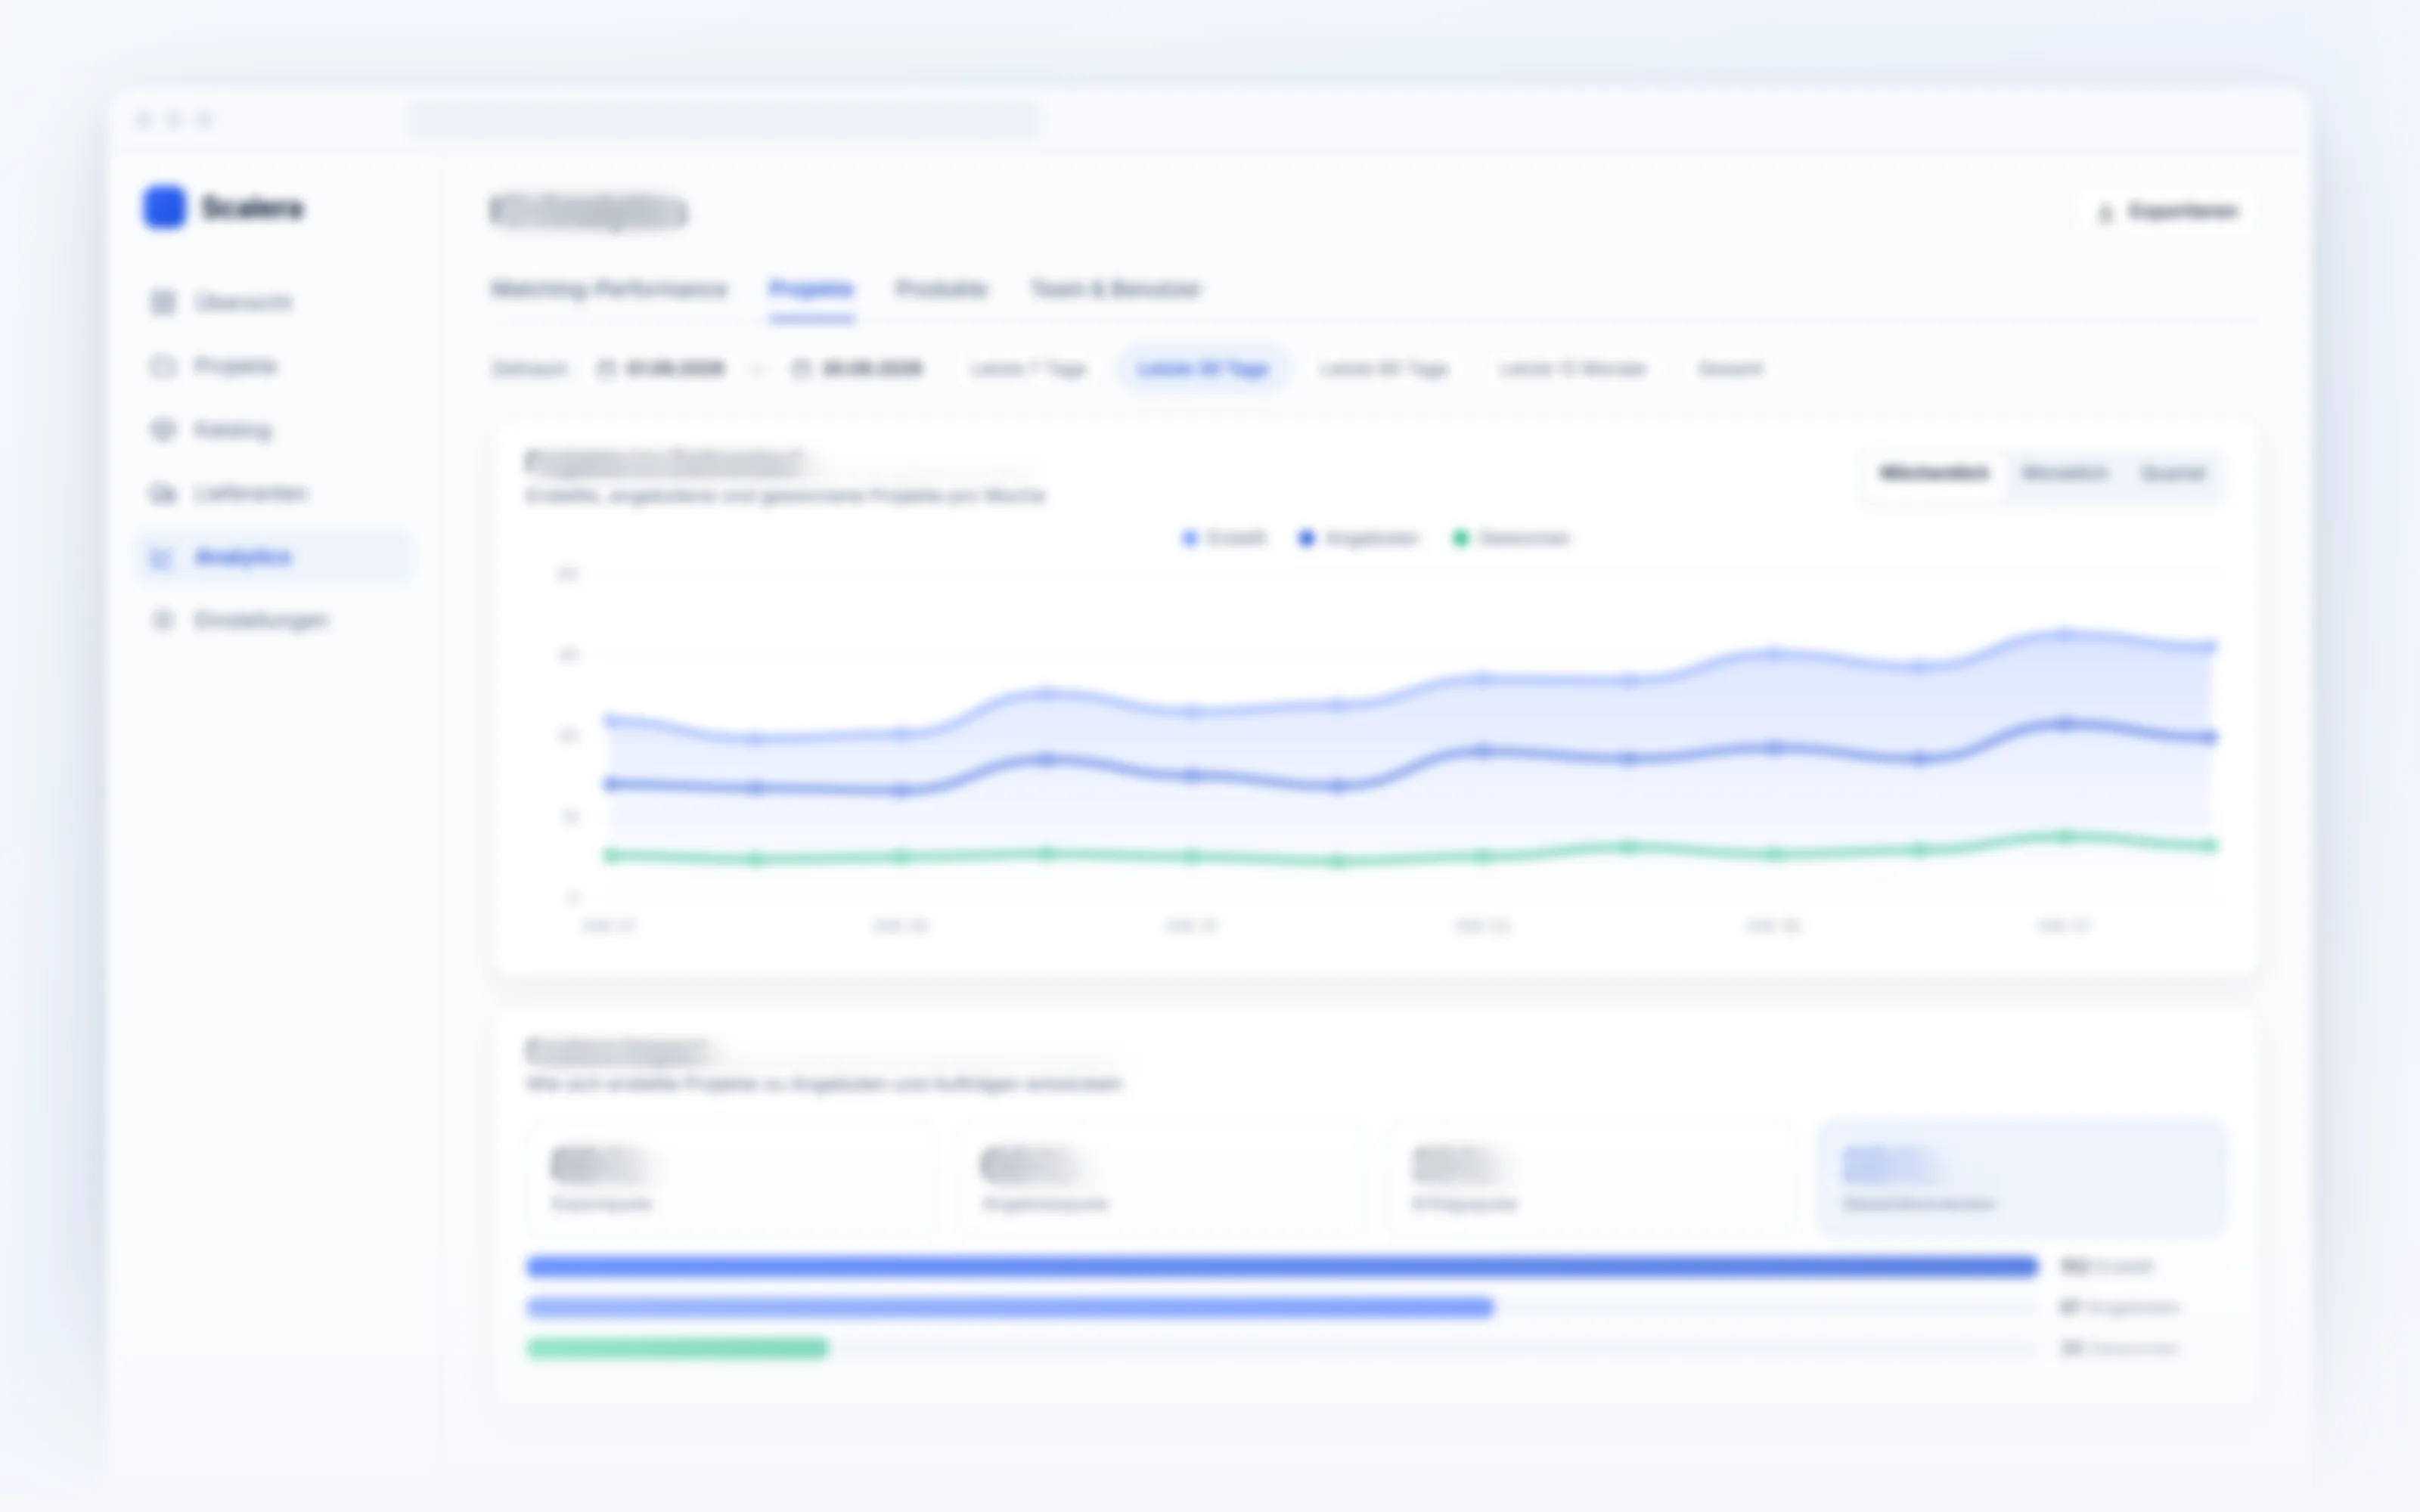
Scalera KI-Analytics, Ansicht Projekte: Verlauf der erstellten, angebotenen und gewonnenen Projekte pro Woche und ein Funnel vom Projekt bis zum Auftrag

Projekte bis zum Zuschlag.

Erstellte, angebotene und gewonnene Projekte, dazu die Konversion im Bereich Scalera Impact.
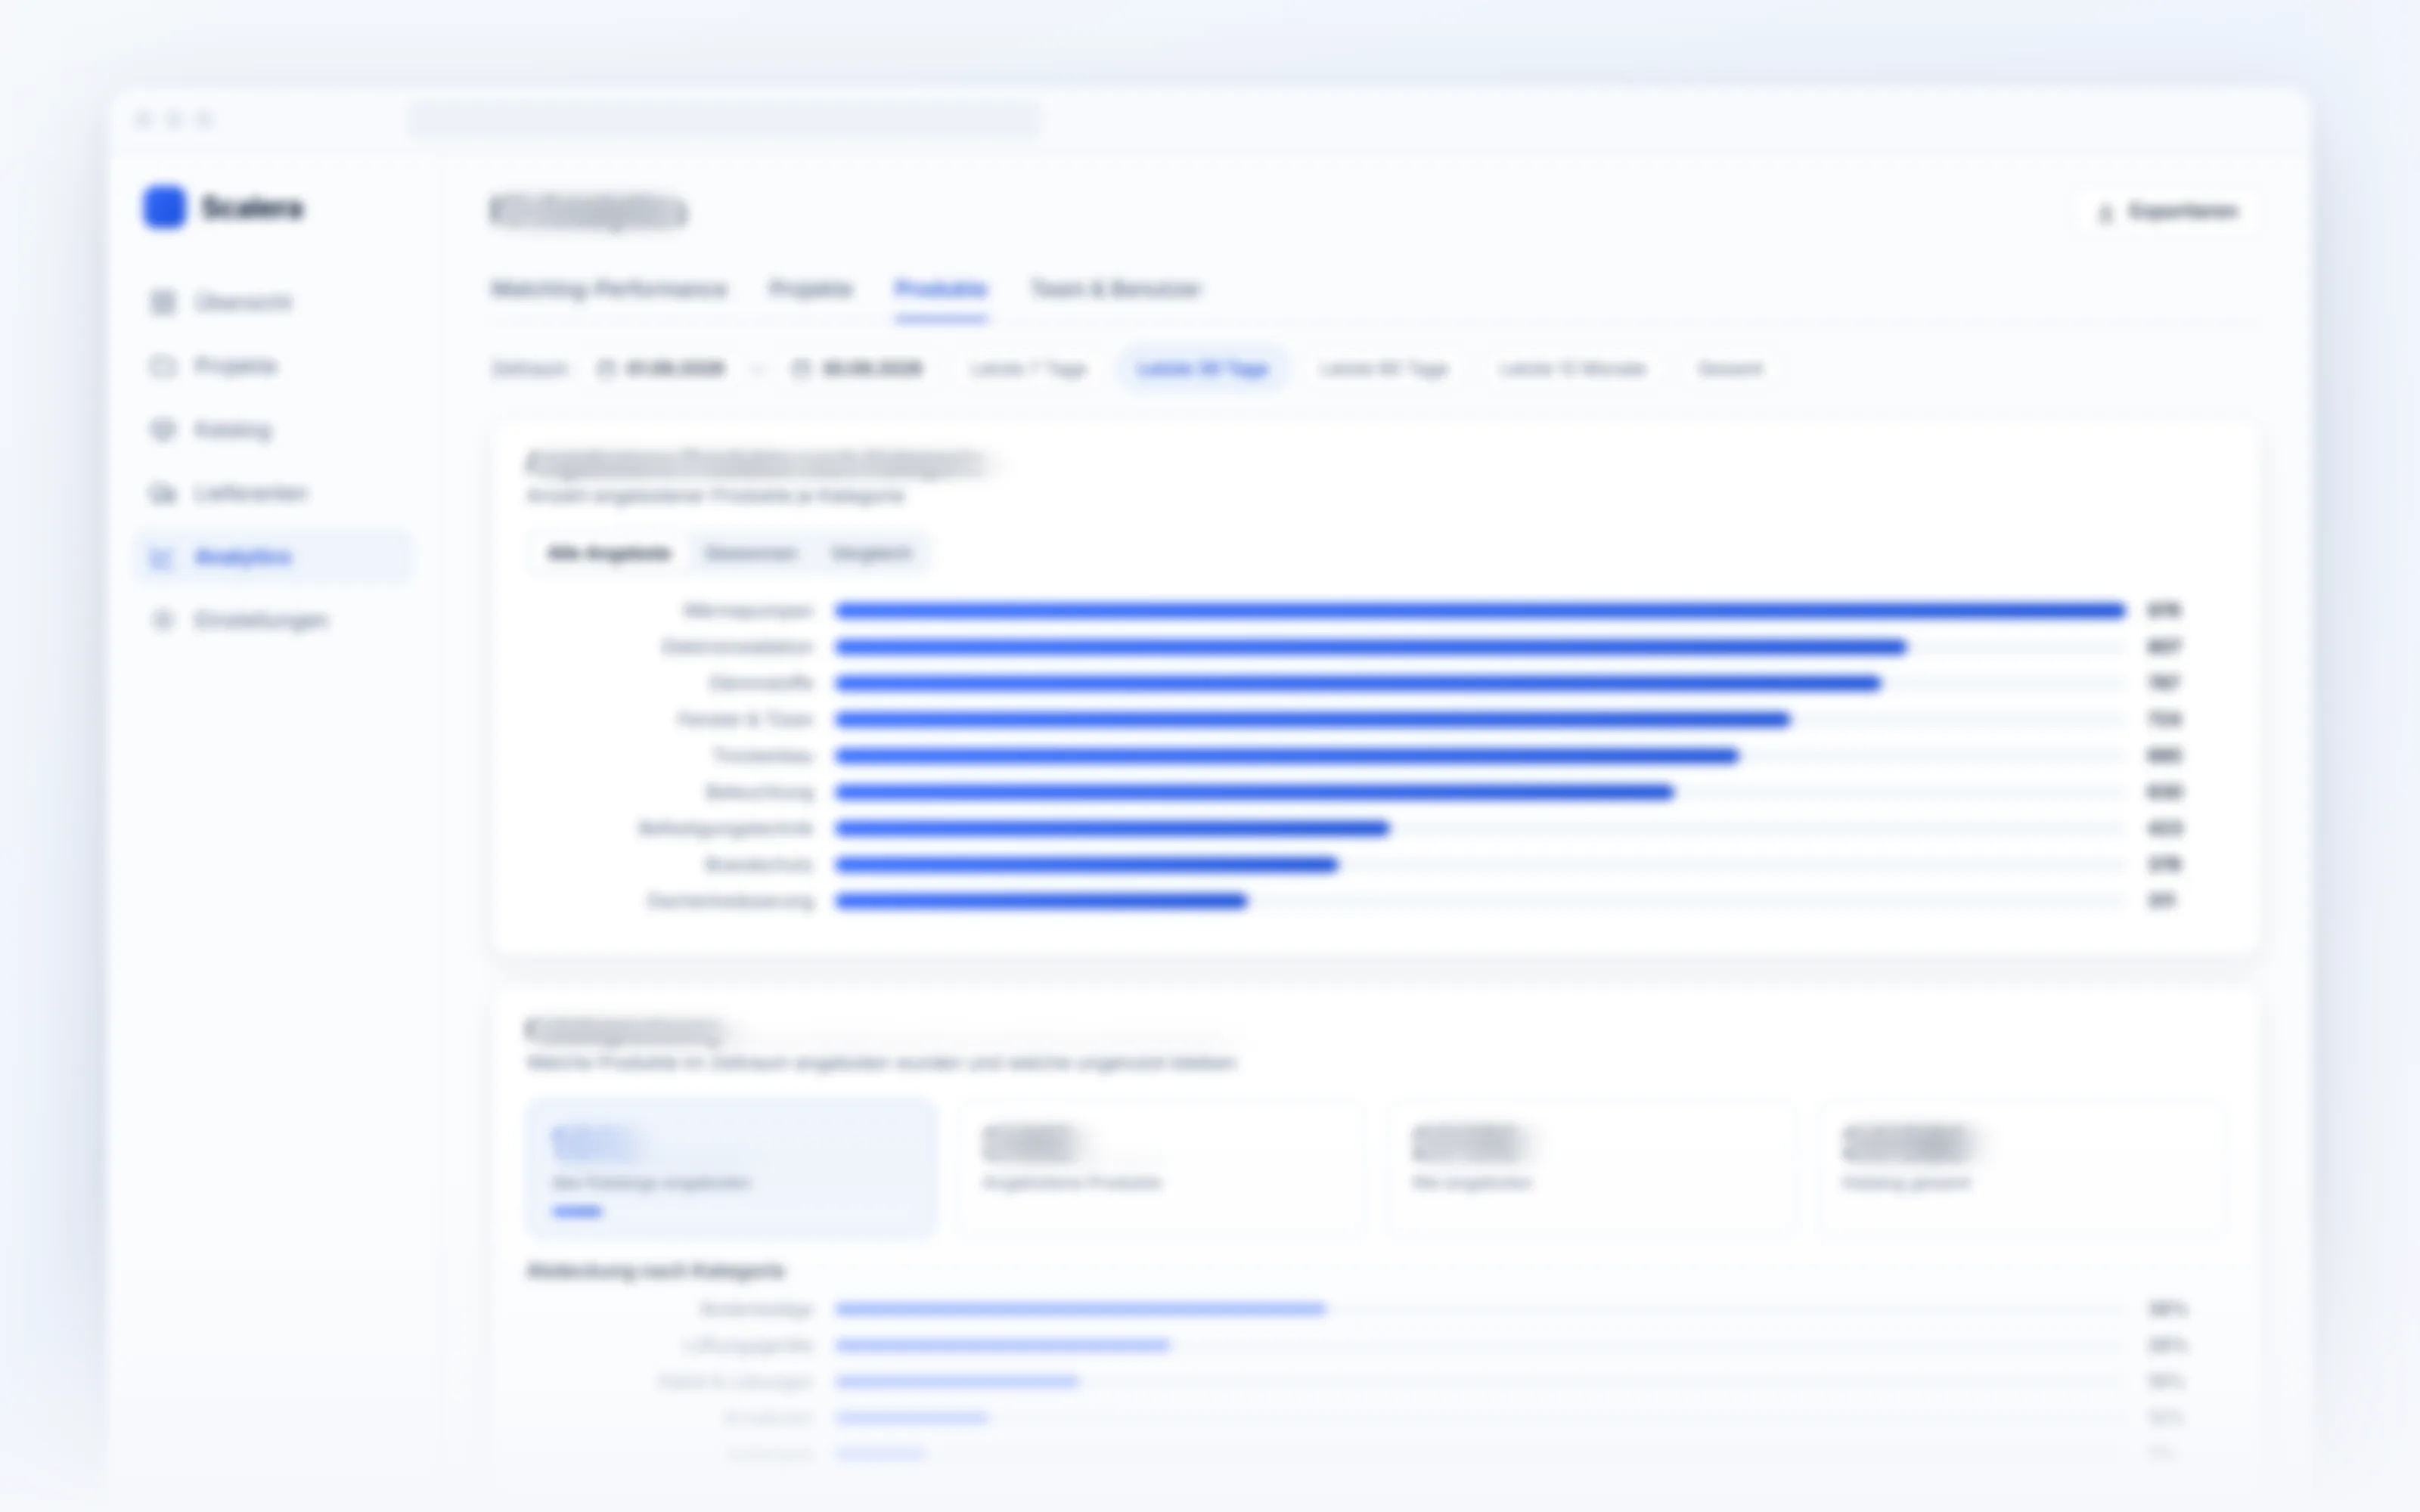
Scalera KI-Analytics, Ansicht Produkte: angebotene Produkte nach Kategorie als Balkendiagramm und die Katalognutzung mit Abdeckung nach Kategorie

Katalog und Lücken.

Angebotene Produkte nach Kategorie, Katalognutzung, Abdeckung und Gap-Analysen.
So nutzt du Analytics

Zeitraum
Letzte 7 Tage30 Tage90 Tage12 MonateVormonatGesamt
1

Zeitraum wählen.

Letzte 7, 30 oder 90 Tage, 12 Monate, Vormonat, alles oder ein eigener Zeitraum.

Korrekturen nach Kategorie
DokumenteProduktkategorien
2

Schwachstellen finden.

Sieh, bei welchen Dokumenten und Produktkategorien die KI am meisten korrigiert wurde.

Team & Benutzer
3

Team steuern.

Die Ansicht Team & Benutzer zeigt Administratoren, wie das Team mit Scalera arbeitet. Alle Auswertungen lassen sich exportieren.

Häufige Fragen

Welche Auswertungen zeigt Analytics?

Matching-Performance, Projekte, Produkte und Lieferantenkatalog sowie Team & Benutzer, dazu Gap-Analysen.

Wer sieht die Team-Auswertung?

Die Ansicht Team & Benutzer ist nur für Administratoren auf Kundenseite sichtbar.

Kann ich die Zahlen exportieren?

Ja. Jede Ansicht hat einen Export.

Results in practice

Frauenthal Handel Gruppe: more than 80 % precision overall and more than 90 % for bills of quantities.

Cover image of the published Scalera case study with Frauenthal Handel Gruppe

“We achieve over 80% precision overall — and already exceed 90% for bills of quantities.”

Florian Bouchal

CSO & Board Member, Frauenthal Handel Gruppe

Read the case study

Three views of your quoting process

Scalera AI Analytics, matching performance view: three KPIs for accuracy, coverage and correction rate, plus a chart showing performance over time

Matching performance.

Accuracy, coverage of relevant items, correction rate, processing time and the trend over time.

Scalera AI Analytics, projects view: created, quoted and won projects per week, plus a funnel from project to order

Projects through to the win.

Projects created, quoted and won, plus conversion in the Scalera Impact view.

Scalera AI Analytics, products view: quoted products by category as a bar chart, plus catalog usage with coverage by category

Catalogue and gaps.

Products quoted by category, catalogue usage, coverage and gap analyses.

How to use Analytics

Period
Last 7 days30 days90 days12 monthsPrevious monthAll time
1

Pick a period.

Last 7, 30 or 90 days, 12 months, previous month, all time or a custom range.

Corrections by category
DocumentsProduct categories
2

Find weak spots.

See which documents and product categories needed the most corrections.

Team & users
3

Lead your team.

The Team & users view shows administrators how the team works with Scalera. Every report can be exported.

FAQ

Which reports does Analytics show?

Matching performance, projects, products and supplier catalogue, team & users, plus gap analyses.

Who can see the team report?

The Team & users view is only visible to administrators on the customer side.

Can I export the figures?

Yes. Every view has an export.

What our customers say

ACO reference image

"Scalera has made us feel that we and our ideas are important."

‍

Marco Dürst, ACO
Marco Dürst

Management

“Scalera has made our supplier communication significantly simpler and more efficient. The tool is easy to use, saves valuable time, and makes our day-to-day work noticeably easier.”

Pius Zurfluh, GAMMA AG Bau
Pius Zurfluh

Managing Director

Dormakaba reference image

We are systematically continuing to build our organization towards data-driven processes.”

Pascal Kägi, Dormakaba
Pascal Kägi

Member of the Executive Board

Frauenthal reference image

“In the past, it took us 30 to 40 minutes for a large tender. Today we are around 10 to 15 minutes with Scalera. That makes a huge difference in our volume.”

Markus Grafl

Head of Central Offer Management

Lazzarini reference image

“Scalera is our new employee in processing offers — thinks quickly, never complains, doesn't take breaks and knows every position by heart!”

Marc Caminada, Lazzarini
Marc Caminada

Construction guide

HEW reference image

“With Scalera, we have significantly streamlined our administrative functions. Today, a central location is enough to optimally support the calculators and at the same time handle significantly more volumes.”

Ciril Disch, HEW
Ciril Disch

Head of Building Construction/Member of Management

“The greatest benefit for us has truly been the time saved. We are effectively saving money.”

Michael Lang

Managing Director

Bring the question your report should answer

No contracts. No long-term commitment.

Used by 150+ manufacturers, dealers and general contractors across Europe.